As the coronavirus vaccines have rolled out across the US, the process has been confusing and disastrous. States, left by the federal government to fend for themselves, have struggled to get a handle on the logistics of distribution. Many, including Georgia, Virginia, and California, have fallen woefully behind schedule.
But even if there were a perfect supply chain, there’s another obstacle: Not all Americans want the vaccine.
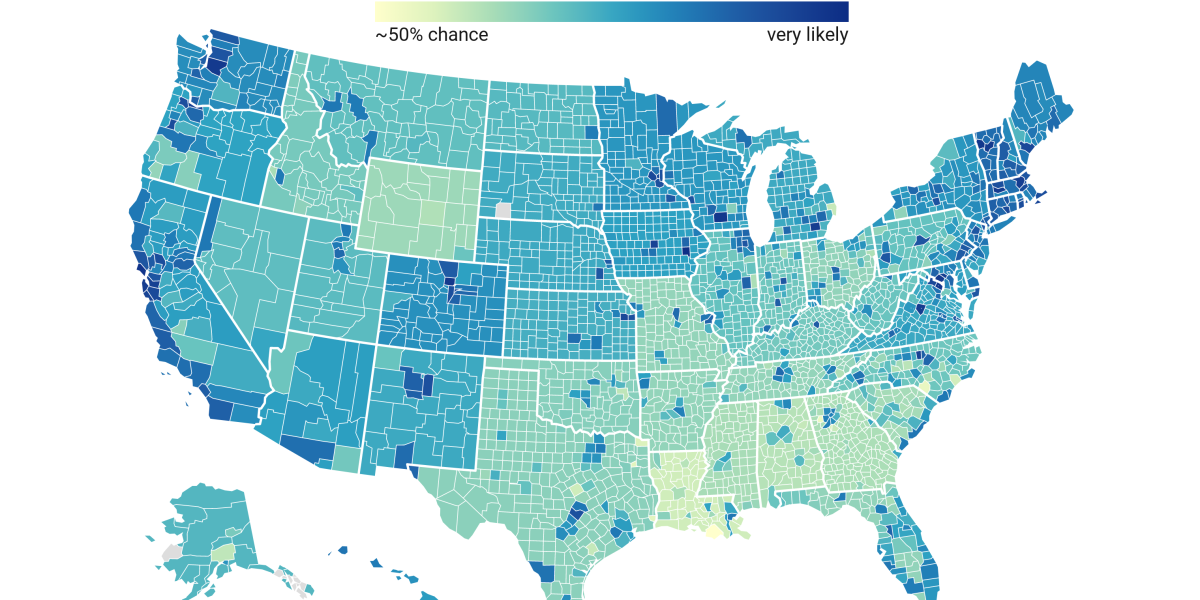
Survey data gathered through Facebook by Carnegie Mellon University’s Delphi Lab, one of the nation’s best flu-forecasting teams, showed that more than a quarter of the country’s population would not get vaccinated if it were available to them today. How people feel about receiving vaccinations varies widely by state and county. The percentage of respondents who would accept a vaccine falls as low as 48% in Terrebonne parish, Louisiana, and peaks as high as 92% in Arlington county, Virginia.
The findings are extremely worrying. The fewer people who are vaccinated, the longer the virus will continue to ravage the country, and prevent us from returning to normal. “It’s one of those things that probably shouldn’t have surprised me,” says Alex Reinhart, an assistant teaching professor in statistics & data science, who was part of the research. “But when you look at the map, it’s still surprising to see.”
The good news—and there is some good news—is that this data could also help fight public hesitancy. The Delphi Lab has been helping the CDC to track and understand the spread of covid infections since the beginning of the pandemic. The latest survey will help the agency identify where to perform more targeted education campaigns. The research group is also working with several county-level health departments to inform local outreach.
The Delphi researchers collected the data via a large-scale survey that it has been operating through Facebook since April 2019. It works with the social media giant to reach as wide a cross-section of the US population as possible, and surfaces daily questions to a statistically representative sample of Facebook users. An average of 56,000 people participate daily, and the company itself never sees the results.
During the pandemic, the survey has included a variety of questions to understand people’s covid-related behaviors, including mask adherence, social distancing, and their mental health. Some of the results are fed into the lab’s coronavirus forecasting model, while others are summarized and given directly to public health officials and other academic researchers. The questions are regularly updated, and the vaccine acceptance question was added at the start of January—after the first vaccines had been authorized by the US government.
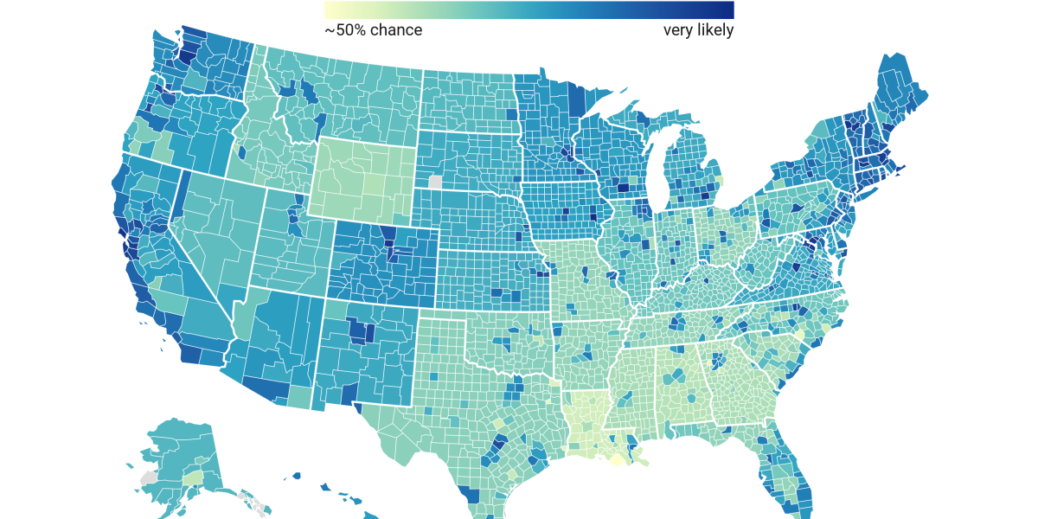
The map visualizes each county’s polling average from January 1 to January 14. For counties with too few daily respondents—less than 100—the Delphi researchers grouped the data from neighboring counties. This is reflected in our map above, which is why various clusters of counties show up with the same percentage. The researchers also independently verified their results with some of the CDC’s own surveys and Pew Research.
Next, the researchers plan to expand their survey to understand why people are reticent about the vaccine. They’re also exploring questions that could help identify what blocks people from accessing vaccines, especially for at-risk populations.
This story is part of the Pandemic Technology Project, supported by the Rockefeller Foundation.


Recent Comments